India – a poor man’s America?
Apart from the fact that India is pretty poor, it has a lot of similarities with USA. Here are 12 of them.
1. Both economies are run by their domestic consumers. In contrast, the economies of China, Japan, Germany and East Asia are powered by overseas customers (through exports).
2. Both economies are heavily dependent on services, particularly information, entertainment, education & knowledge related. In contrast, China, Germany and Japan are dependent on manufacturing.
3. Both countries import far more than export. In contrast, Japan, Germany and China have reverse.
When will India and China overtake US in GDP (nominal terms)?
Here are some charts from Goldman Sachs research. China is expected to overtake US around 2035 and India is expected to overtake US in 2040 and then it will be the race between the two Asian giants.

iPad: Apple’s Tablet has finally arrived


People in tech were anticipating this device for a long time. In Microsoft we had plenty of informal watercooler discussions on this gadget, and the past year the media has been running plenty of rumours. Finally here is the much awaited device, announced by Steve Jobs yesterday. For most of the jouranlists it was underwhelming and while it is a great device it is not yet a complete replacement for you laptop.
Gross Domestic Product per unit area

Gross Domestic Product (GDP) is a very important measure in macroeconomics that measures the total value a nation (or a region) produces. It is the fundamental unit through which most measurements of wealthiness, growth and economic importance are measured. Higher the value of GDP, richer the country is.
However, in computing the GDP the area of the region is never taken into account. Though a 1999 paper by John Gallup and Jeffrey Sachs introduce the concept of GDP density (Per-capita income * population density), they didn’t elaborate it and use it to understand the economies. Area Intensive measure could show some insight into an economy – whether the value produced by an economy is people centric or whether it is resource centric. For a country like Saudi Arabia (sitting on world’s largest oil reserves) almost all value is produced from the land, while for a country like Singapore almost all value is the people. GDP’s area intensity can be a useful measure for policymakers and analysts to understand the nature of an economy. There are some interesting insights that this measure can show.
Here is the GDP per sq.mile. The extremes are Russia and Singapore, with Singapore producing 2500 times more value per sq. mile. Russia and Brazil as the chart shows are primarily land centric in GDP value additon, while Germany, UK and Japan are highly people centric. This means the fortunes of Russia and Brazil would swing hard with commodity and agricultural prices and these economies will be highly impacted. Western Europe and Japan on the other hand will remain stable with commodity prices, but will see their fortunes impacted by labor demographics and productivity. As labor force ages and diminishes, economies with more people centricness would face major upheavals.
The three major economies of tomorrow – US, China and India are very close to each other and in the middle of pack. They will partly be impacted by commodity price change and partly from demographic changes, but would be on far better footing due to the balance.
| Area (sq. mi) | GDP_PPP ($ million) | GDP in $million per sq.mi | |
| Russia | 6,601,668 | 2,260,907 | 0.342475114 |
| Brazil | 3,287,612 | 1,981,207 | 0.602627987 |
| China | 3,705,407 | 7,916,429 | 2.136453296 |
| India | 1,269,219 | 3,288,345 | 2.590841297 |
| USA | 3,717,813 | 14,264,600 | 3.836825575 |
| Germany | 137,882 | 2,910,490 | 21.10855659 |
| UK | 93,800 | 2,230,549 | 23.77984009 |
| Japan | 145,920 | 4,354,368 | 29.84078947 |
| Singapore | 272 | 238,755 | 877.7757353 |
Interestingly this measure also indicates India is not as poor as other statistics show. Unlike US or China, it doesn’t have enough area to increase food production, the land to build dams, industries and infrastructure, and the mineral and energy resources to spur the industrial revolution. Given the lesser area, it means India has to emulate Western Europe and Japan in building more of a people centric economy rather than emulating just China and USA.
Business models and Entrepreneurs
Wonder 1:
What is the difference between startup entrepreneurs and non-entrepreneurs? Is it that one of them has a great notion about business strategy while the other doesn’t? No. In fact, both of them don’t have a friggin clue about business models. The difference is one of them takes the forward step with a mix of guts, greed, passion and appetite for risk. The other doesn’t.
Wonder 2:
Why do all those strategy and business professors, with apparently lots of business ideas, don’t make a dime making something, while Steve Jobs or Larry Page who don’t write about strategy still make billions? The difference is the profs are waiting for a perfect business idea that satisfies all their models, while an entrepreneur lifts up his finger and just does it. The people who talk about strategy more often than not have little clue of actually building a business. They can talk & analyze post-facto, but cannot predict the success/failure before it actually happens.
Most salient economic trends of the decade
What are the most important trends in the last decade? Which ones will continue and which ones will turn? I have taken 7 major trends – gold, US stocks, emerging markets, debt, interest rates, housing and tech.
1. Spectacular rise of Gold.
 From early 80s till the end of 90s, gold was a laggard. As inflation fears receded (thanks to China’s low cost exports) and growth fears subdued (due to “unreal” 90s – when growth skyrocketed due to open markets worldwide), gold’s role was really questioned. Most mainstream commentators thought gold bulls were dinosaurs and gold investing was anachronistic.
However, gold would prove its detractors wrong.
50 trillion dollars gone poof
According to an Asian Development Bank report, the total loss from this crisis will reach 50 trillion dollars, almost equal to the annual GDP of the world. With 50 trillion you can give everybody in earth $8000 or buy enough burgers to cover 10 times the distance of earth and sun, or give a BMW 3 series car to every household on earth. You could also buy enough rice or wheat or corn to feed for the lifetime of every human on earth (assuming an average consumption of 350kg/year).
http://www.bloomberg.com/apps/news?pid=20601087&sid=aZ1kcJ7y3LDM&refer=worldwide
The value of global financial assets including stocks, bonds and currencies probably fell by more than $50 trillion in 2008, equivalent to a year of world gross domestic product, according to an Asian Development Bank report.
Asia excluding Japan probably lost about $9.6 trillion, while the Latin American region saw the value of financial assets drop by about $2.1 trillion, said Claudio Loser, a former International Monetary Fund director and the author of the report that was commissioned by the ADB. The report didn’t give a breakdown of asset declines in other regions.
Here is the full study.
Japan is no longer a saver – it is now emulating USA
Japan is joining the United States club. I guess it got tired of keep saving to just see its strength get eroded. Heck, now US is saving more than Japan J.
http://www.economist.com/finance/displayStory.cfm?story_id=13240636&source=hptextfeature
In the six months to January, it had an annualised trade deficit of ¥4 trillion ($39 billion), compared with a surplus of almost ¥11 trillion a year earlier.
total current-account surplus plunged to only ¥125 billion in December, 92% less than a year ago.
the saving rate of households has fallen from 18% of income in 1980 to an estimated 1% last year
The fall in saving is exactly what the “life-cycle hypothesis” would predict. People like to smooth consumption over their lifetimes, so during their working years they spend less than they earn and accumulate wealth, which they then draw down once they retire.

Fix up the US healthcare
 While me might all argue about why US healthcare is broken and how to fix it, I guess the fact of the matter is clear – US healthcare is broken. In fact it is ridiculously broken. There are plenty of research works out there with generous stats. In almost every health stat, US looks extremely poor.
- US healthcare spending/GDP is the second highest in the world (next to Marshall islands)
- US spending for healthcare of $6102/percapita is almost double than most other OECD countries – $3165 in Canada and $3043 in Germany and $1149 in Korea – highest in the world
Why is a trading tax, a bad thing?
Congress wants to bring a new tax on trading. For every $5000 you trade, government wants to take $12.50. Well that doesn’t sound bad for long term investors, right? No. Taxing trade can significantly impact the market efficiency. Take a look at chart 1 that has transaction costs (in basis points) for a few economies.
Chart 1

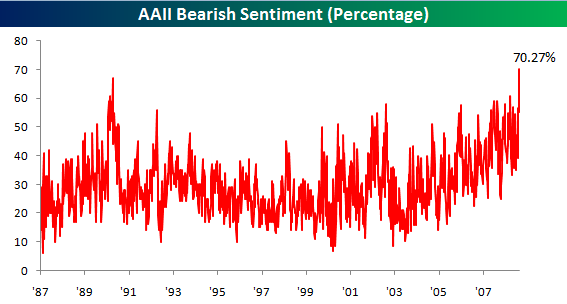
70% of Small investors turned bearish – Indication of bottom?
 70% of small investors are bearish. This could mean that the temporary bottom is getting closer. While I still believe that the long bottom is much lower, maybe even below 5000 for Dow, we might be due for a bear rally based on various indicators.
Image source:http://www.ritholtz.com/blog/wp-content/uploads/2009/03/aaii-bears.png
Globe mail article on this Retail Investors say “Run”
Barron says this might indicate a bottom:
Vodpod videos no longer available.
Also see:
http://latimesblogs.latimes.com/money_co/2009/03/panic-equals-op.html
When do we say the market bottomed?

Here is a list of 10 things marketwatch considers to be the signal of a bottom. It is an interesting reading, though I don’t accept all their conclusions.
-
A significant (more than 10%) one- or two-day drop in the market.
-
Timothy Geithner is replaced with Paul Volcker.
-
The 100th day of a bankruptcy by General Motors Corp.
-
Gold at $2,000 an ounce.
-
The Dow Jones Industrial Average changes more than two names at the same time, and/or adds names to increase the overall number of stocks in the index.
-
New York Stock Exchange daily volume drops to 1 billion shares for 30 sessions in a row. "Sometimes you just need everyone to give up to make a bottom," the analysts reasoned.
-
One million jobs lost in a month.
-
The market starts to rally on bad news.
-
Stock market favorites see 15% to 20% declines. When standout companies — such as Wal-Mart Stores Inc.) — "get clobbered" you’ll know a bottom is near, they said.
-
CNBC goes off the air.
These companies benefitted from AIG bailout
Wall Street Journal identifies the beneficiaries of the AIG bailout for the first time.

Tutorials on CDOs and Synthetic CDOs – what everyone of you must know
CDOs and Synthetic CDOs are the biggest culprits of the current crisis. But, how much of it do you know. Spend some time, understanding them through these tutorials.
Day 1:
Ford – A relative bright spot in Detroit
Ford is substantially transforming its company and only major car company not asking its government for support (even Toyota is asking Japanese government). To be sure, it is still has a long way to go, but atleast they are going in the right path.
Here is a relevant Forbes article on this:
Ford has put its two Detroit rivals on the spot. Chrysler and General Motors are already on the hook to the U.S. government for some $18 billion between them, and pleaded for more last month.
In return, they’re supposed to be striking deals to reduce their liabilities with stakeholders – unions, dealers and lenders. But Ford (F, Fortune 500), which hasn’t tapped Washington for aid, is beating them to it.
Here is a Wall Street Journal interview with its CEO:
Job losses getting severe
Today’s Wall Street Journal reports on the bad job data released by Bureau of Labor Statistics today. 
Executive Summary
The economy has shed 4.4 million jobs since the recession began in December 2007
Nonfarm payrolls, which are calculated by a survey of companies, fell 651,000
Unemployment rate rose from 7.6 to 8.1 percent
2.9 million people were unemployed more than six months
Average hourly earnings increased a modest $0.03, or 0.2%, to $18.47
Service-sector employment tumbled 375,000
S&P Index for 137 years
Here is the regression trend on S&P index. However, take this data with a pinch of salt, as S&P 500 didnt exist back in 1870 (it is just an extrapolation of a trend) and most of the American bluechips came after the Long Depression of 1870s.
Companies came during or end of Long Depression:
Standard Oil (1870) – mother of most oil companies today, including XOM, Goldman Sachs (1882), AT&T (1880-85), J&J (1887), GE (1890), JP Morgan (1895), Ford (1903)
Still, this chart has some insight.

Source: Dshort.com
Field report – Future of India and commodities

In January, I was visiting a few villages in India partly to understand how global markets are affecting them. After spending a week in Europe and a few weeks Indian cities, the villages marked a refreshing contrast. As I walked in the fields, I saw that the villagers were happy, gave me free juicy sugarcanes and they were more upbeat about economy that anybody else. As we will see, if India were to consume as much oil per-capita as a relatively poorer Eastern European nation like Slovenia, it alone needs 30 million barrels/day (mbpd) more (40% of world consumption) apart from another 35 mbpd from China. If they both want to consume as much as US, India needs about 60 million addition barrels apart from 70 mbpd for China (current world production of the order of 85 mbpd).
These villages might never get to the economic level of an average American or European countryside, their per-capita income might never get closer to that of an average American, but the changes going on in these nameless places will have a profound impact on world’s commodity, tech and consumer markets. And this could change the wage-commodity price relationship substantially.
Auto Sales screwed up everywhere
A slew of bad news is hitting the world auto markets. Three of the biggest markets – Japan, Europe and USA are simultaneously hit with problems.

Source: BusinessWeek
‘Slumdog Millionaire’ – A Stimulus package for India?
 India started out deriding slumdog millionaire “poverty tourism”, but now has completely embraced. While 8 oscars is surely a big boost, it is the 2 Oscars given to A.R. Rahman that holds very special for most Indians. While it maybe just a movie, it might actually set off an interesting chain reaction.
It could help spread globalization and bring India more to the global markets. And it can open up newer products and newer markets to be created, and that could partly help economic revival. The story of 300 million middle class and 500 million other aspirants for middle class, all of whom barely tapped by global corporations, is not going to be lost even if S&P cuts Indian bonds to Junk tomorrow. Indian growth story is for there to stay, even if going with lesser hype and more reality. Slumdog is really the symbol of it. It shows India’s realities, but still manages to capitvate the global audience. Indians have no real reason to be embarrassed with the realities – it just happens for any growing country.
Funny Math Video
Who said recessions must be gloomy. Enjoy the fun with the recession math:
Special Report – Recession impact on various sections of the society
Executive Summary
-
82% are job loss are among men. Women are going to pass men in workforce for the first time
-
West is hit the most compared to North east and MidWest
-
Young, blacks and Hispanics are hit more in the recession
-
Artists face a far worse time than other professions though their unemployment rate is not different from average population
-
Uneducated lost more jobs than educated workforces, unlike the previous 2 recessions.
-
With various government policies and market movement, misery could be spread to everyone, including rich
-
Portland and St. Louis rank among the unhappiest cities in the US
Emerging market indices that have grown in the past 3 months
 MarketWatch has a good report on the progress in emerging market indices the past 3 months. While some of the indices have gone up, I would really be careful of some of those countries. While countries like China and to some extent India and Brazil seems a relatively safe long term bet, given their size and demographics, it is not clear how other countries will fare in the crisis of a lifetime. Chile and Israel are stable democracies and good rule of law, but given their smaller size it is not clear if they can face a sizable change in global trade patterns. Argentina and South Korea might get into deeper trouble, based on their fragile financial systems as seen in the recent history.
Here is the the report.
Of the 23 country benchmarks that comprise the widely watched MSCI Emerging Market Index, 14 have outperformed the S&P 500.
Driving this outperformance, investors have bet that economies which rely heavily on exports and commodities are poised to benefit first when the global economy starts to recover.
MSCI EM index, which as of last week had rallied 8% since the S&P 500’s Nov. 21 low, now shows only a 1.5% advance.
The gains since November didn’t come easy, arriving on the heels of steep yearly losses for the markets as the credit crisis tightened its grip and consumer and investor sentiment slid. The Bovespa ended 2008 down 53%, ending five years of consecutive gains. The Shanghai Composite fell 65%, Taiwan’s Taiex dropped 46% and the Merval tumbled 54%.
